Following the Seasonal Changes in Trace Elements in Particulate Matter in the Arctic
22 11月 2021
Polar regions are widely studied for the effects of climate change and for the impact of unusual natural events and human activities on the climate itself. Warming in the Arctic has occurred much more rapidly than the global average and in particular the Ny-Ålesund archipelago has experienced a significant rise in temperature over the last two decades [1]; an effect known as Arctic amplification.
Particulate matter (PM) can influence the chemical and radiative properties of the atmosphere. These particles can transport material through the atmosphere, and they can act as cloud condensation nuclei affecting the optical properties of the atmosphere. The transport of particulate matter from low and medium latitudes towards the polar regions may dramatically impact the quality of these fragile areas. To understand the role that aerosol could have in variation in the level of solar radiation, reduction of visibility and possible pollution of the ecosystem it is useful to know the geochemical characteristics of the PM that reach Arctic areas. In addition, the aerosol composition could significantly affect the snow pack chemical composition and the load of specific elements [2]. The chemical composition and size distribution of the aerosols can also distinguish between local sources and long-range atmospheric transport processes and on the atmospheric processes modifying their properties during atmospheric transportation.
Despite their low concentrations, trace elements (TE) and rare earth elements (REE) are important components of aerosol. Transported to polar regions, they may provide important information about local and global circulation and on source areas principally due to conservative behaviour of certain elements like REE and some TE when transported by aerosol. Elements deriving from various sources, such as volcanic emissions, biomass burning and anthropogenic activities, such as agricultural fires, are generally related to the finest component of aerosol and having a long residence time in the atmosphere can be the result of a long transport [3].
Carlo Barbante and his team [4] present the results of an analysis of the six size fractions of 46 samples collected during a one-year sampling campaign that took place from 26 February 2018 to 26 February 2019 at Ny-Ålesund in the Svalbard Archipelago with a time resolution from 6 to 10 days. They evaluated the seasonal variation in Arctic aerosol of 27 TE (Li, Be, Mg, K, Ca, V, Cr, Mn, Fe, Co, Ni, Cu, Zn, Ga, As, Y, Rb, Sr, Ag, Cd, Cs, Ba, Tl, Pb, Bi, U and Th) and 14 REE (La, Ce, Pr, Nd, Sm, Eu, Gd, Tb, Dy, Ho, Er, Tm, Yb and Lu). In addition, a multi-stage impactor, which accumulated particles with cut-off diameters of 10.0 μm, 7.2 μm, 3.0 μm, 1.5 μm and 0.95 μm on slotted quartz fibre filters (QFF) and <0.49 μm on the backup filters. was used to sample aerosol in six size fractions to better evaluate and differentiate local and long-range inputs. Samples and blanks were stored at −20 °C until analysis.
Instrumental Analysis
Briefly, the slotted and backup QFF were cut in half. Each filter was extracted twice in an ultra-sonic bath at 10 °C for 15 min using ultrapure water (ELGA LabWater Pulse and flex) The slotted filters and the back-up filters were extracted in a first step with 9 and 25 mL of ultrapure water followed by a second step with 1 and 5 mL of ultrapure water, respectively. The extracts were unified, filtered and immediately frozen until the analysis. All samples and field blank filters were handled inside an ISO5 clean room under a laminar flow bench (class 100). All 300 samples were analysed at the Institute of Polar Sciences-CNR/University of Ca’ Foscari laboratories in Venice to determine water-soluble TE and REE by means of an iCAP-RQ ICP-MS after acidification with nitric acid. Levoglucosan and methanesulfonate (MSA) were used as specific markers for biomass burning and phytoplankton blooms, in comparison with the concentration of TE and REE to confirm potential emission sources.
Results
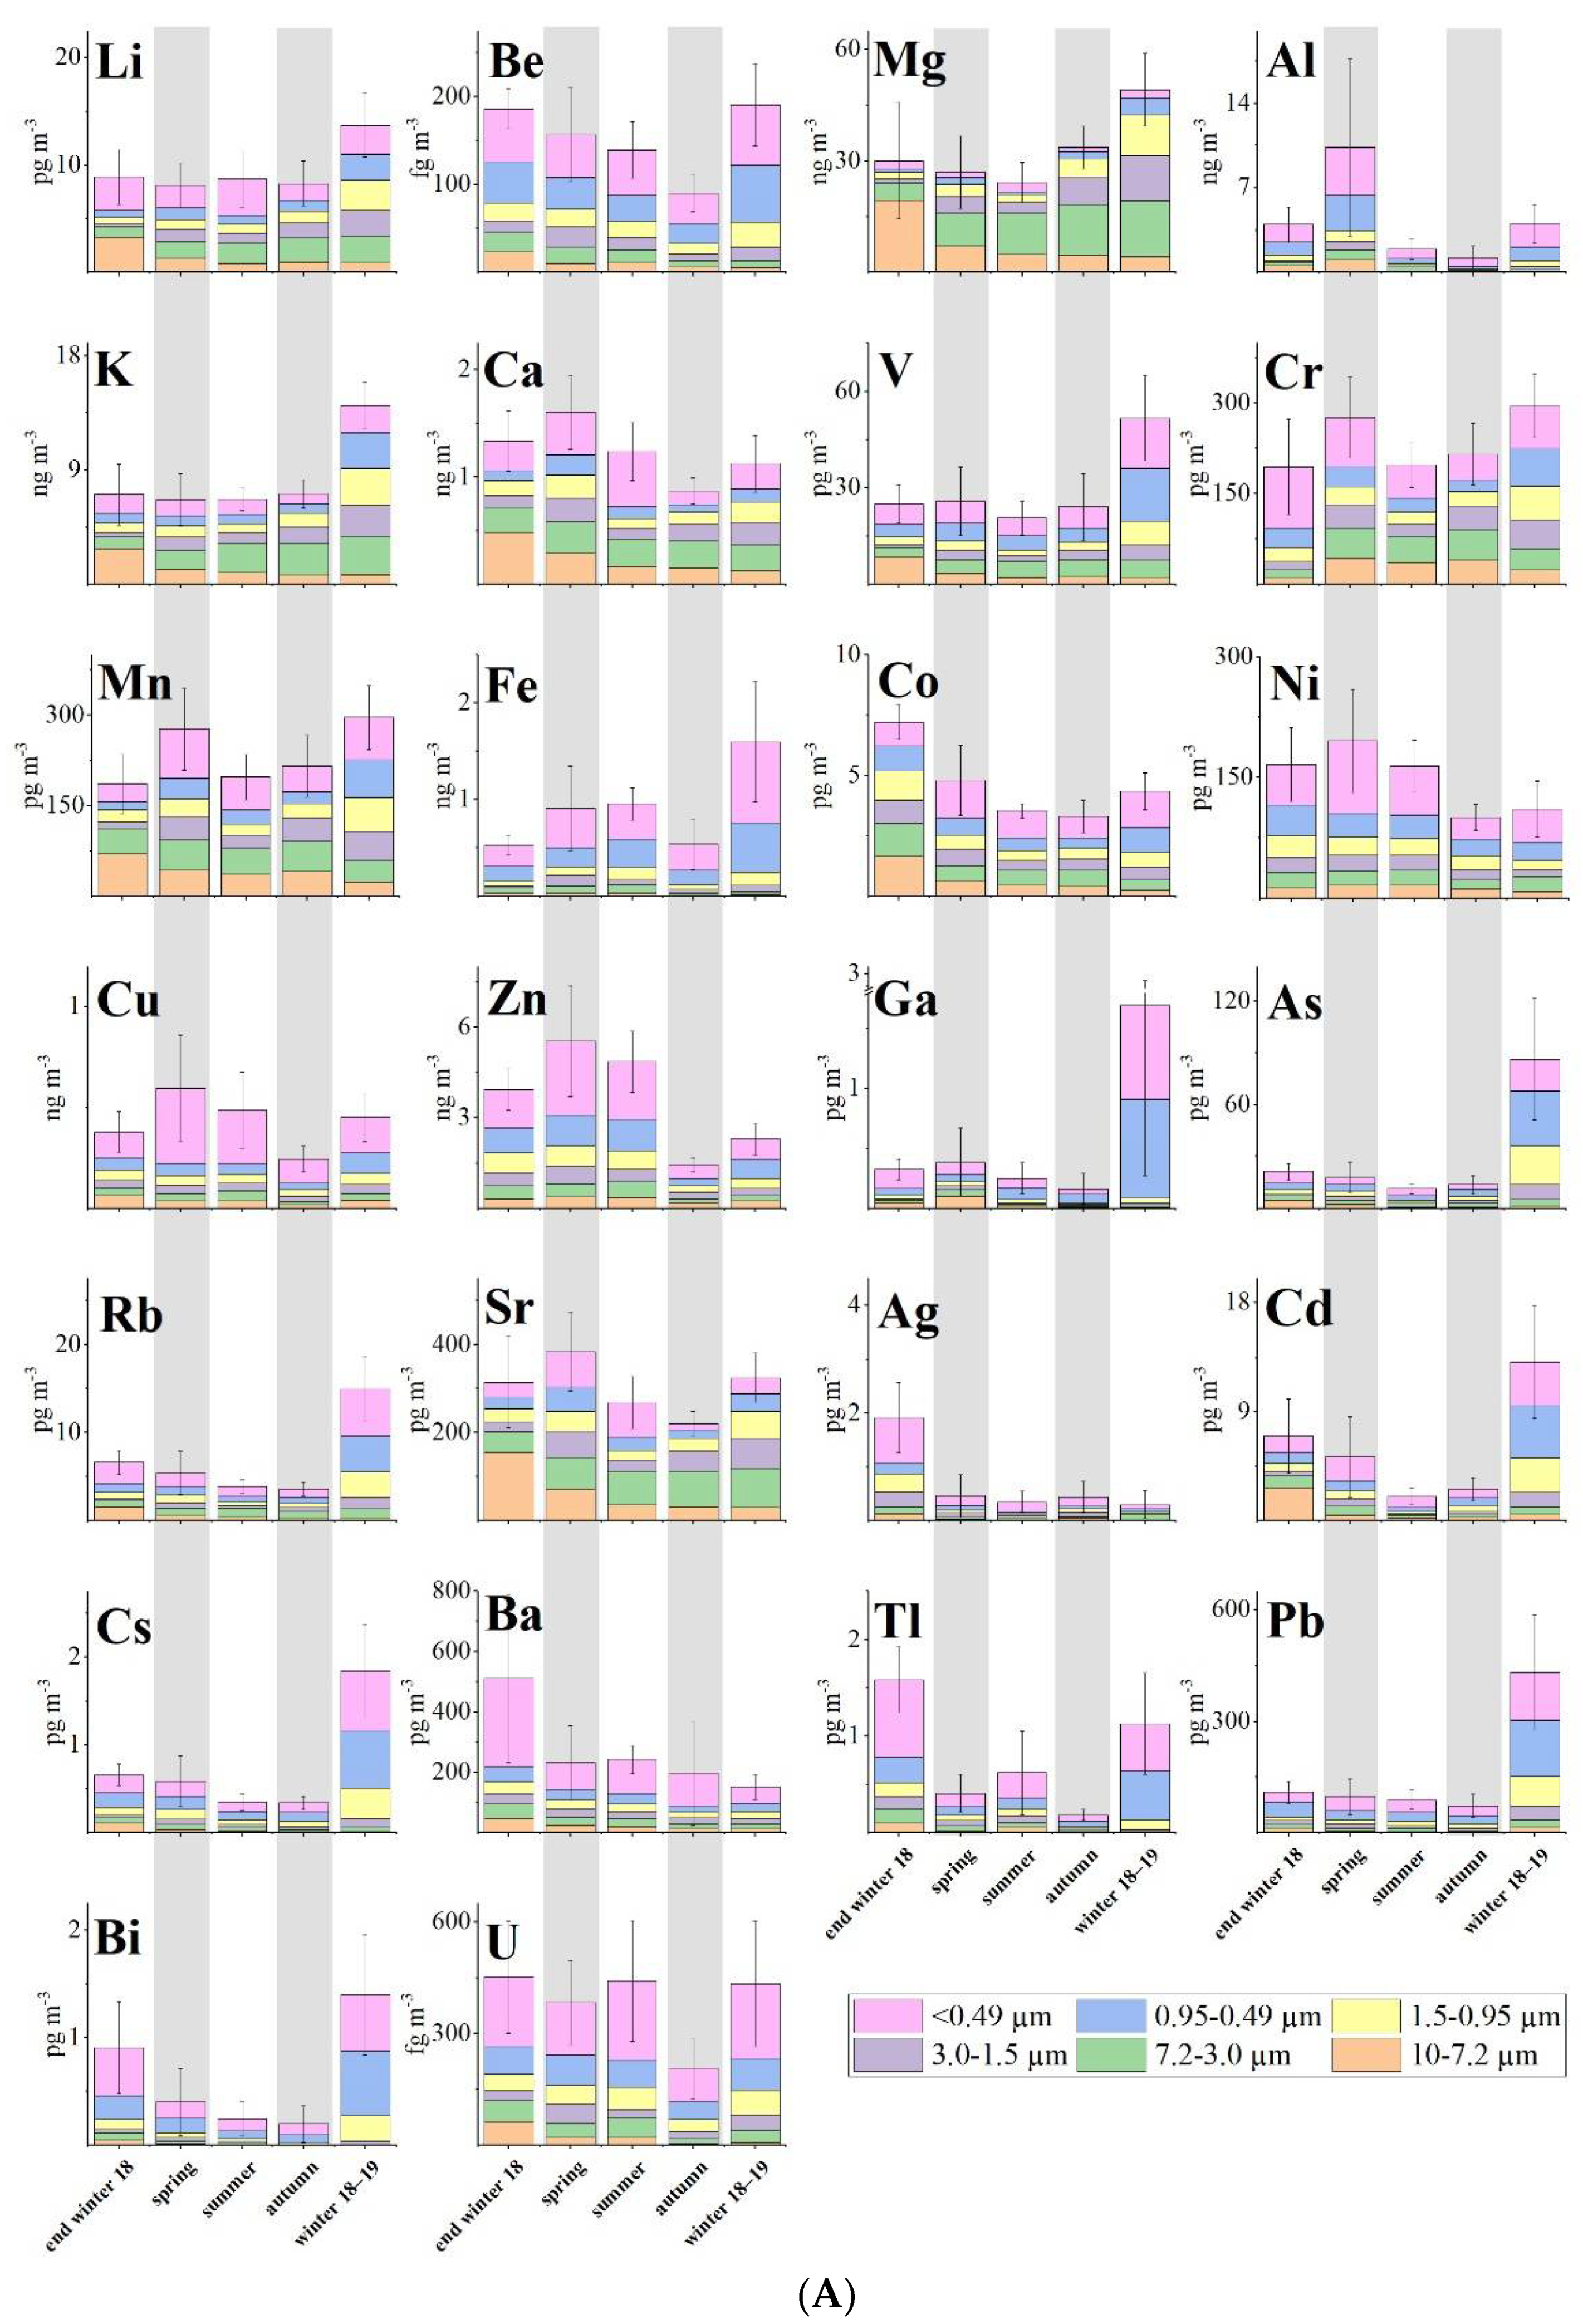
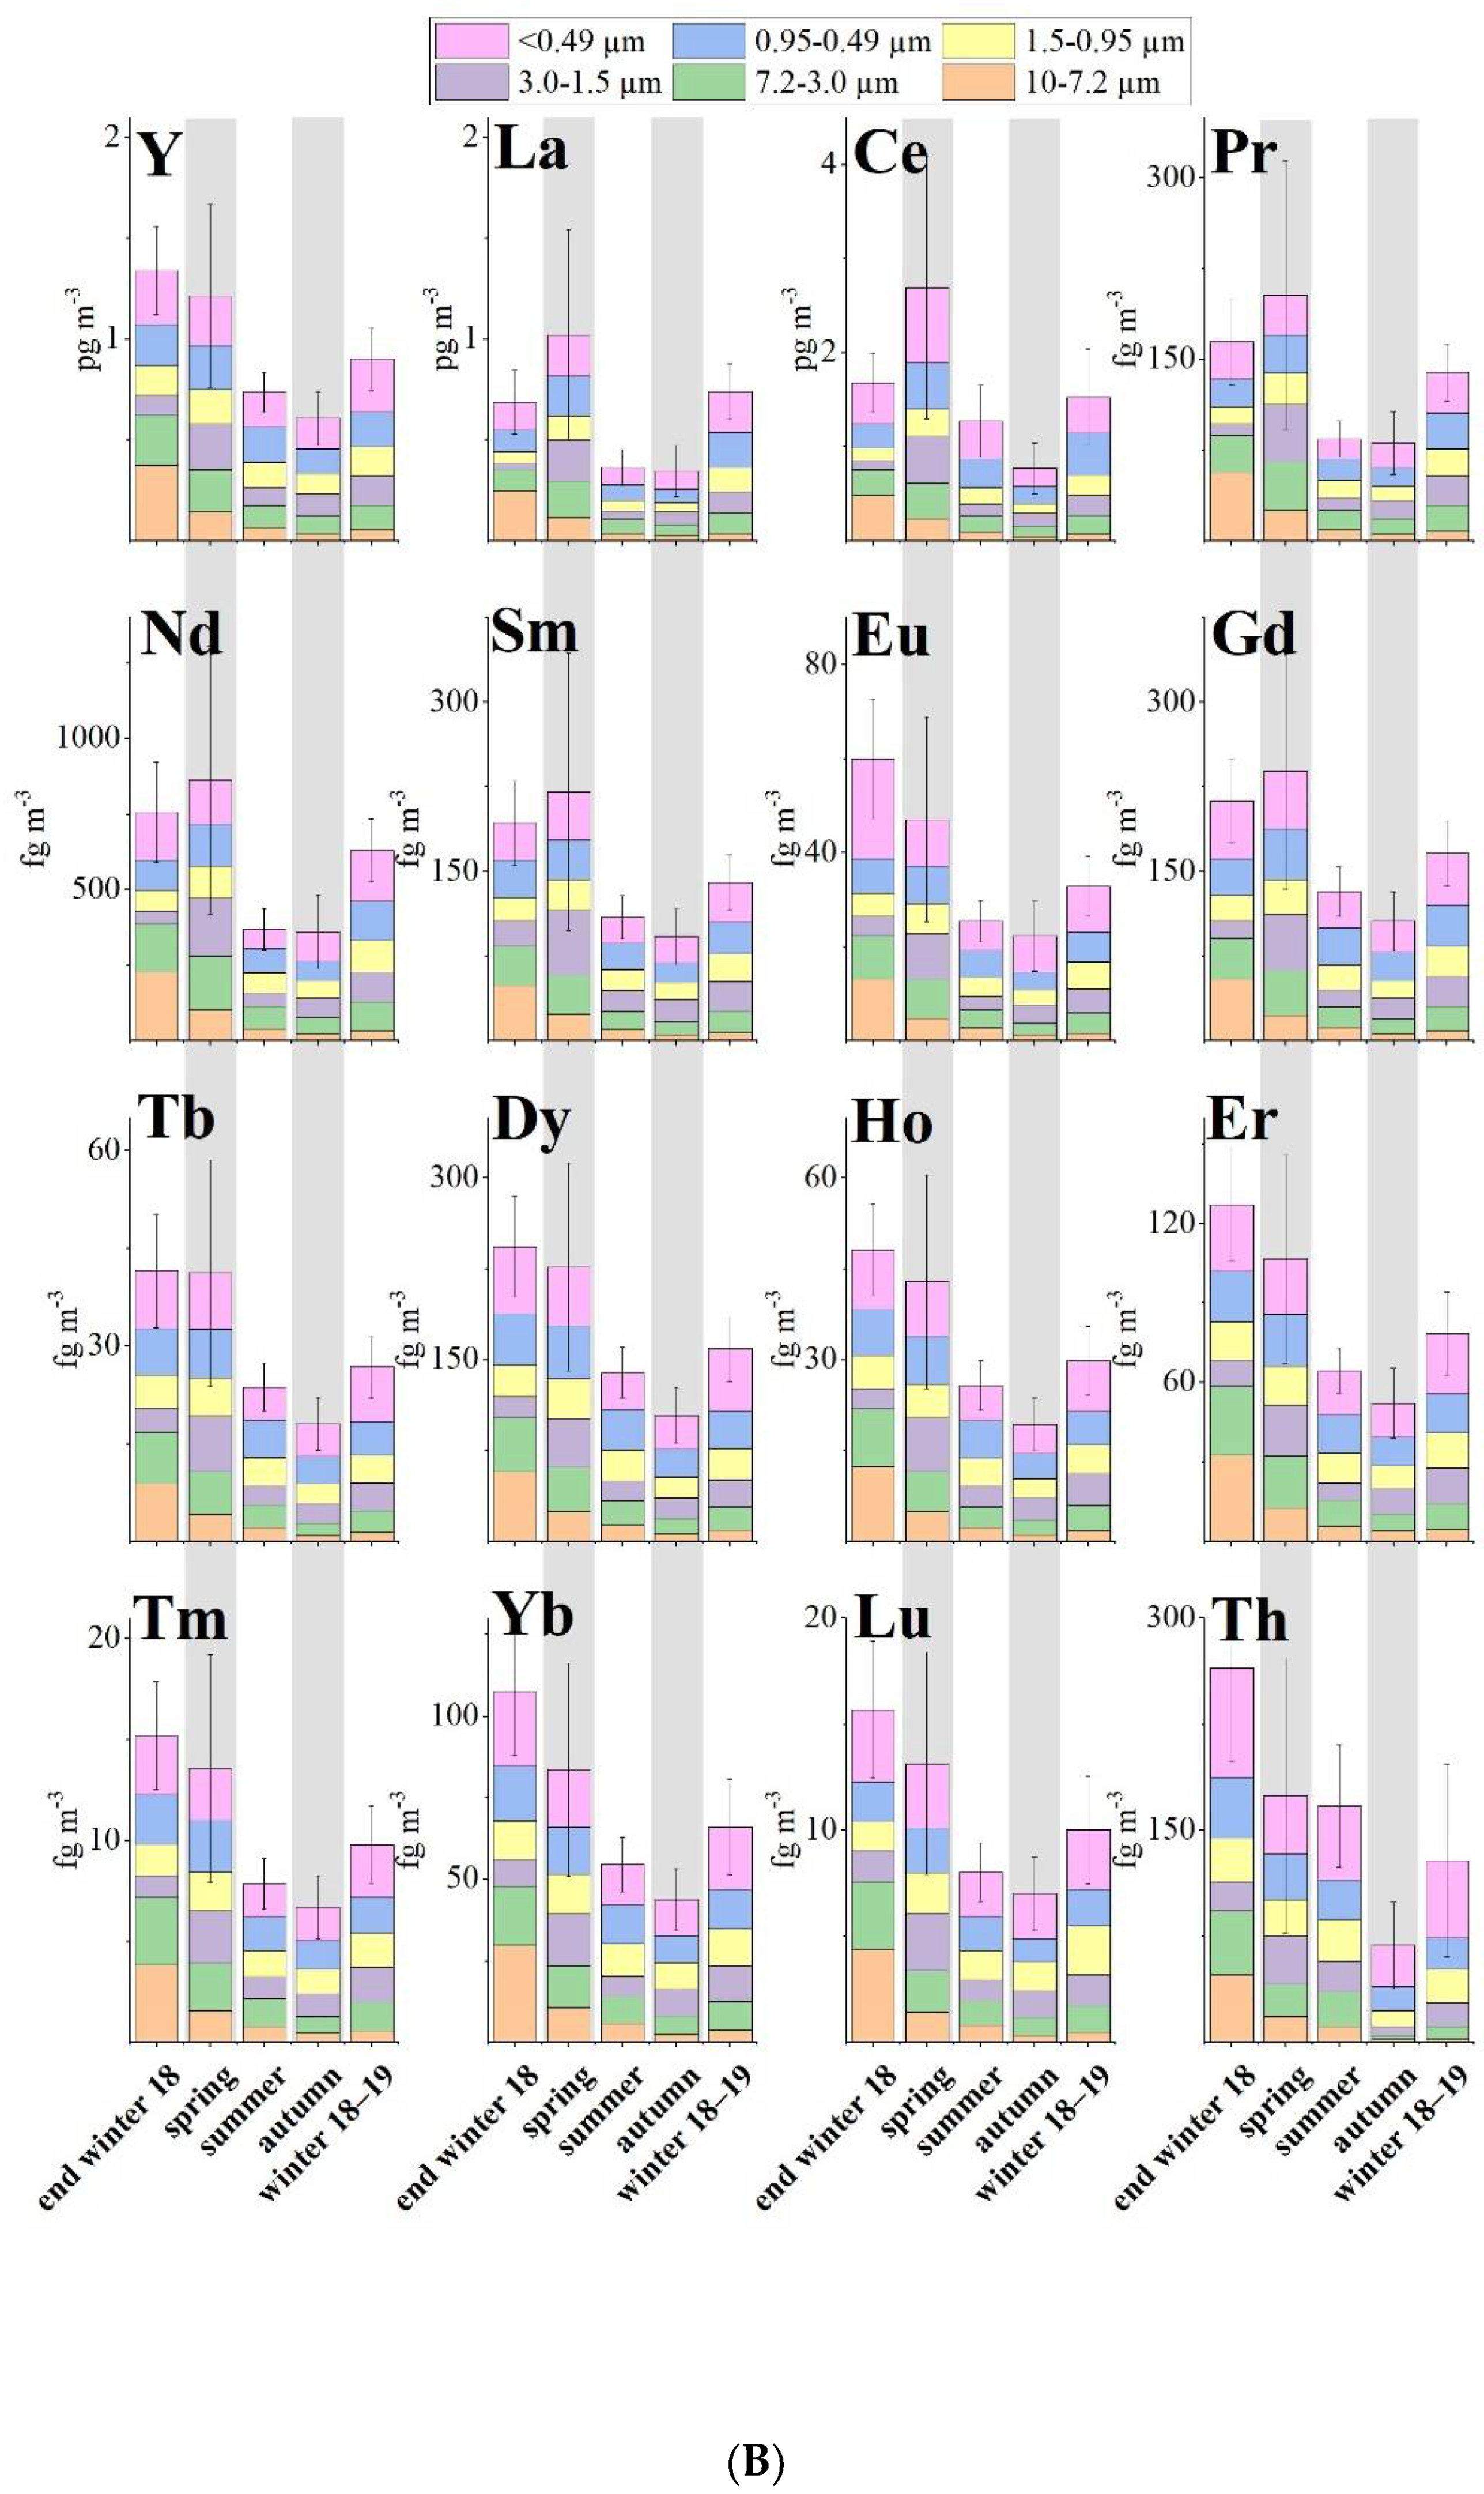
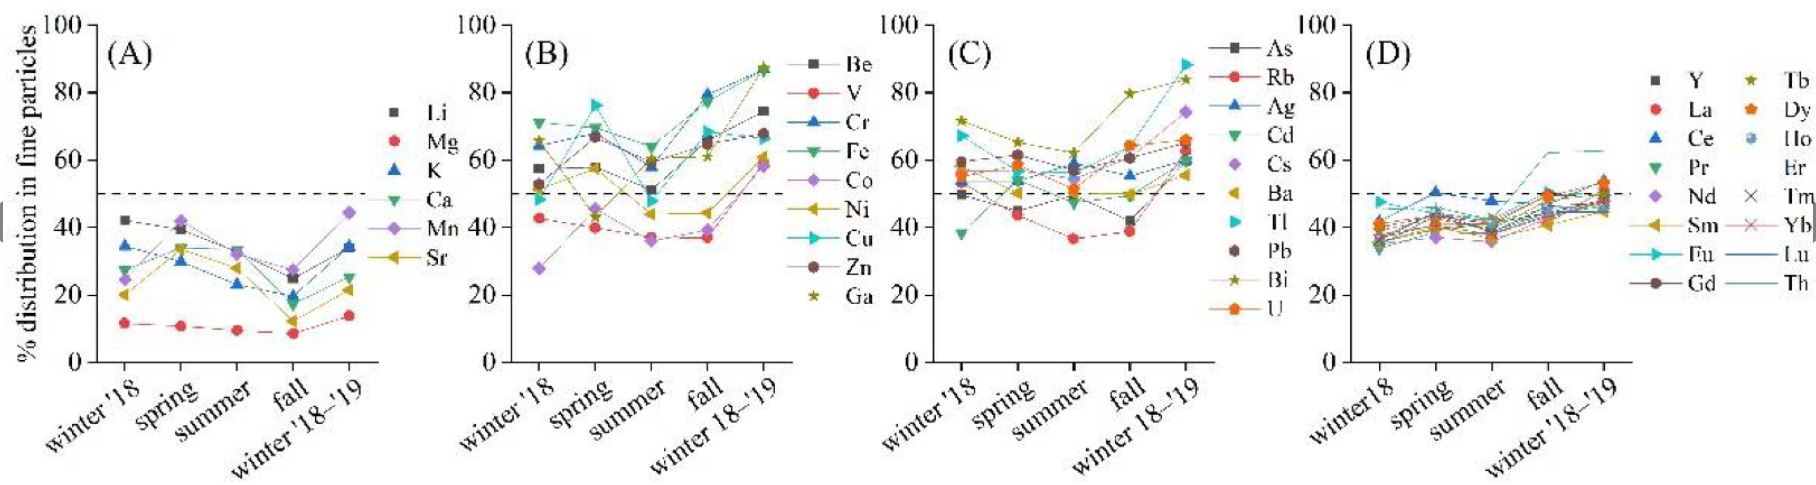
Mg (30 ± 13 ng m−3), K (5 ± 2 ng m−3), Zn (3 ± 2 ng m−3), Ca (1.1 ± 0.4 ng m−3) and Fe (0.8 ± 0.2 ng m−3) were the most concentrated TE in the whole sampling period, The other TE were abundantly <1 ng m−3. Mg, K, Ca, Li and Mn were mainly distributed above 0.95 µm (coarse fraction), suggesting a local source (Figure 1A and Figure 2A). These metals did not show a valuable shift in the particle-size distribution during the whole sampling period, while the other TE varied remarkably among the season with a shift in the fine fraction in spring and in winter (Figure 1A and Figure 2B,C).
The most abundant REE was Ce (2 ± 1 pg m−3), followed by La (0.6 ± 0.5 pg m−3) and Nd (0.6 ± 0.4 pg m−3), following the normal order of abundance of most crustal materials (Ce > La > Nd > Sm > Yb). The REE were equally distributed between coarse and fine fractions (Figure 1B). A slight shift toward the fine fraction in winter was detected (Figure 2D). This is frequently linked with an increase in concentration of wsTE and wsREE (Figure 2) suggesting that the long-range atmospheric transport seems to be the dominant factor of the presence of metals in the Arctic atmosphere.
During summer, transport from the mid-latitudes decreased due to the contraction of the polar vortex, while in winter the long-range atmospheric transport covers a more extended area [3].
Interpretation
Different approaches were applied to interpret the results and to recognize the PM sources using the water-soluble TE and REE as tracers.
Trace element enrichment factors (EFs) relative to the Earth’s crust concentrations can highlight the contribution of non-natural sources to elemental levels. Similarly, marine EFs (MEFs) are used to estimate the influence of marine sources. Zn, Cd, Cu and As are the most enriched elements indicating a non-geogenic origin. Ag, Pb, Ni, Cr and Bi have values indicating that they are only weakly related to the crust. Th, Fe, Ga, REE, Rb, Ca, Be, Cs, Y and U show a geogenic origin. K, V, Li, Mn, Ba, Co, Tl, Sr and Mg have values that indicated a probably geogenic source; but, especially in summer and autumn, these elements have values indicating probable mixed sources. Values from Bi, Cr, Ni, Pb, Ag, As, Cu, Cd and Zn suggest that anthropogenic sources are responsible for the concentrations of these elements. It has to be noted that, during summer, the EF values of all stages are similar for each TE due to the presence of local sources as the main input. In contrast, during winters and spring, different values of EFs are found in the different stages because long-range transport plays an important role in the PM composition.
The MEFs for Ca and K have values confirming their marine origin. Li, Rb and U seem to have a prevailing marine input but other sources must be considered. All other elements appear to have sources other than the marine one.
While one year is probably not long enough, the information obtained confirms the ability of TE and REE in tracing PM, both in terms of source area and seasonality when different sizes of the particles are considered.
Why Choose ELGA LabWater?
The major investigation described in this blog is typical of many successful environmental projects using broad ultra-trace multi-component analytical methods that rely with confidence on the high purity – freedom from both inorganic and organic impurities - and consistency of water produced by every generation of ELGA LabWater water purification systems. This alone would give great confidence in choosing ELGA LabWater.
References
- Maturilli, M.; Hanssen-Bauer, I.; Neuber, R.; Rex, M.; Edvardsen, K. The Atmosphere Above Ny-Ålesund: Climate and Global Warming, Ozone and Surface UV Radiation. In The Ecosystem of Kongsfjorden, Svalbard; Springer: Cham, Switzerland, 2019; pp. 23–46. ISBN 978-3-319-46425-1
- Spolaor, A.; Moroni, B.; Luks, B.; Nawrot, A.; Roman, M.; Larose, C.; Stachnik, Ł.; Bruschi, F.; Kozioł, K.; Pawlak, F.; et al. Investigation on the Sources and Impact of Trace Elements in the Annual Snowpack and the Firn in the Hansbreen (Southwest Spitsbergen). Front. Earth Sci. 2021, 8, 1–10.
- Stohl, A. Characteristics of atmospheric transport into the Arctic troposphere. J. Geophys. Res. Atmos. 2006, 111, 1–17.
- Turetta, C., Feltracco, Barbaro, E., Barbante, C., M. Spolaor, A, Gambaro, A. A Year-Round Measurement of Water-Soluble Trace and Rare Earth Elements in Arctic Aerosol: Possible Inorganic Tracers of Specific Events Atmosphere 2021, 12(6), 694; https://doi.org/10.3390/atmos12060694
Dr Paul Whitehead
After a BA in Chemistry at Oxford University, Paul focused his career on industrial applications of chemistry. He was awarded a PhD at Imperial College, London for developing a microwave-induced-plasma detector for gas chromatography. He spent the first half of his career managing the analytical support team at the Johnson Matthey Research/Technology Centre,specialising in the determination of precious metals and characterising applications such as car-exhaust catalysts and fuel cells. Subsequently, as Laboratory Manager in R&D for ELGA LabWater, he has been involved in introducing and developing the latest water purification technologies. He now acts as a consultant for ELGA.